Cari dalam skrip untuk "3 ema"
MAX EMA FibonacciVisualizza in un unico indicatore fino a 5 EMA, di default è impostata la serie di Fibonacci (21,55,69,144,233)

Double EMAThis indicator drops to EMA on your chart. by default it's using different number of bars to calculate the short and long range indicators per time frame. This system is wildly used by professionals to avoid false reading on market's trend and better make decisions. Remember, the crossing of these two indicators should not be used for getting a signal. Instead, you can look into long indicator to see the global market's trend and look at short indicator if the market is reversing the direction of trend to avoid false signals by other systems you may use.
There is also an input and when you check mark the check box, you can tweak the numbers and the two custom numbers will totally override the default ones to make it suite your needs.
Bunch of EMAThere isn't any fancy stuff here, just bunch of EMA to add, remove and change setting easily.

Triple EMA difference colors - GcNaif PandorraTriple EMA difference colors
* choose colors on your choice
* choose wave count on your choice

B3 EMA RibbonAs a person versed in other languages of script, I am sharing my first pinescript. I have just thrown together some EMA lines and testing out the fill() function. I have some 400+ indicators I could make and share, so cheers to many more! As I get more versed in the language, I will make more intricate studies based on high math and sound strategy.

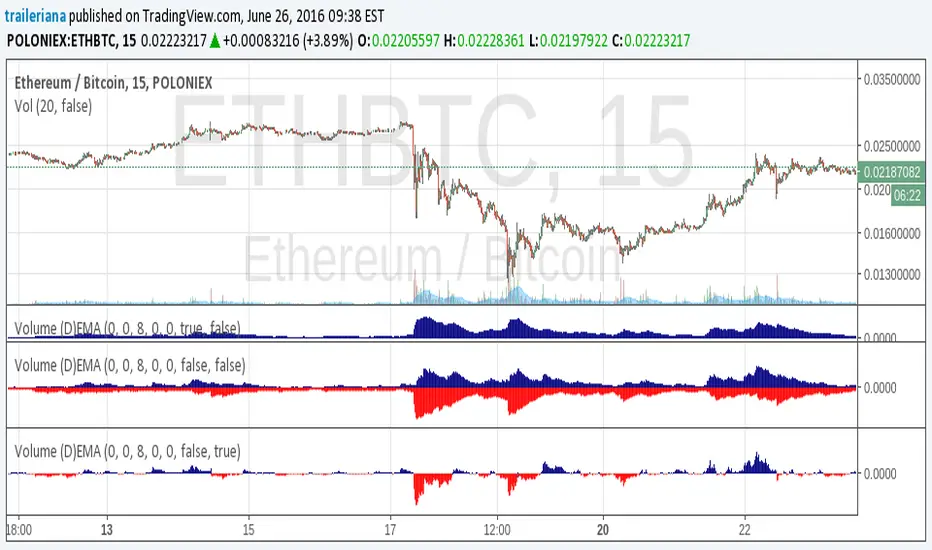
Volume (D)EMAA simple yet configurable indicator that shows recent traffic volumes.
The time period is specified as weeks/days/hours/minutes, not as bars.
For using the generalized double EMA, set the velocity to something other than zero.
Single Timeframe EMAThis plots EMAs from higher timeframes on intraday charts. Very useful for finding areas of S/R

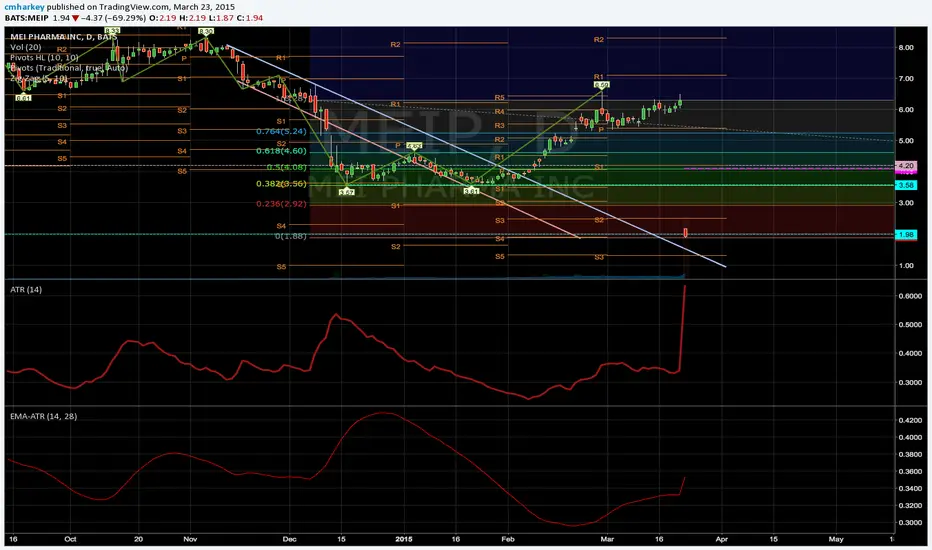
Moving Average of Average True Range - EMA ATRSo I came across the need of wanting to smooth out the ATR of something that has some violent swings in it in order to better place some stops.
Simply put the output of the ATR into the EMA function.
Everything is labeled easily in the settings window you you can clearly change period length for each function.
EMA Wave Indicator [LazyBear]This is a 3 EMA visualization tool. Relative momentum across 3 timeframes are rendered as A/B/C waves. Also, helpful in identifying spike/exhaustion bars.
When all the waves are in the same direction, the momentum is very high on that direction. I have made all options configurable, have fun tuning for your instrument :)
Complete list of all my indicators:
docs.google.com

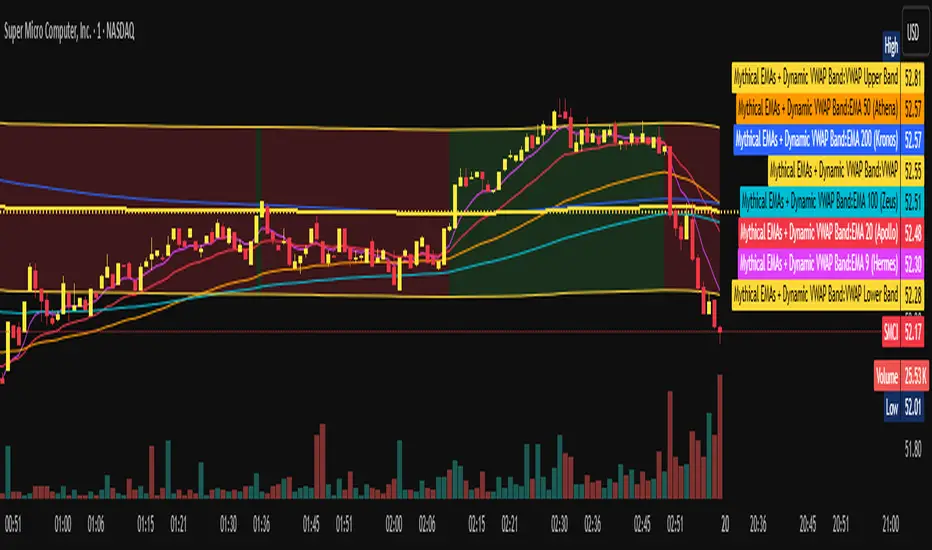
Mythical EMAs + Dynamic VWAP BandThis indicator titled "Mythical EMAs + Dynamic VWAP Band." It overlays several volatility-adjusted Exponential Moving Averages (EMAs) on the chart, along with a Volume Weighted Average Price (VWAP) line and a dynamic band around it.
Additionally, it uses background coloring (clouds) to visualize bullish or bearish trends, with intensity modulated by the price's position relative to the VWAP.
The EMAs are themed with mythical names (e.g., Hermes for the 9-period EMA), but this is just stylistic flavoring and doesn't affect functionality.
I'll break it down section by section, explaining what each part does, how it works, and its purpose in the context of technical analysis. This indicator is designed for traders to identify trends, momentum, and price fairness relative to volume-weighted averages, with volatility adjustments to make the EMAs more responsive in volatile markets.
### 1. **Volatility Calculation (ATR)**
```pine
atrLength = 14
volatility = ta.atr(atrLength)
```
- **What it does**: Calculates the Average True Range (ATR) over 14 periods (a common default). ATR measures market volatility by averaging the true range (the greatest of: high-low, |high-previous close|, |low-previous close|).
- **Purpose**: This volatility value is used later to dynamically adjust the EMAs, making them more sensitive in high-volatility conditions (e.g., during market swings) and smoother in low-volatility periods. It helps the indicator adapt to changing market environments rather than using static EMAs.
### 2. **Custom Mythical EMA Function**
```pine
mythical_ema(src, length, base_alpha, vol_factor) =>
alpha = (2 / (length + 1)) * base_alpha * (1 + vol_factor * (volatility / src))
ema = 0.0
ema := na(ema ) ? src : alpha * src + (1 - alpha) * ema
ema
```
- **What it does**: Defines a custom function to compute a modified EMA.
- It starts with the standard EMA smoothing factor formula: `2 / (length + 1)`.
- Multiplies it by a `base_alpha` (a user-defined multiplier to tweak responsiveness).
- Adjusts further for volatility: Adds a term `(1 + vol_factor * (volatility / src))`, where `vol_factor` scales the impact, and `volatility / src` normalizes ATR relative to the source price (making it scale-invariant).
- The EMA is then calculated recursively: If the previous EMA is NA (e.g., at the start), it uses the current source value; otherwise, it weights the current source by `alpha` and the prior EMA by `(1 - alpha)`.
- **Purpose**: This creates "adaptive" EMAs that react faster in volatile markets (higher alpha when volatility is high relative to price) without overreacting in calm periods. It's an enhancement over standard EMAs, which use fixed alphas and can lag in choppy conditions. The mythical theme is just naming—functionally, it's a volatility-weighted EMA.
### 3. **Calculating the EMAs**
```pine
ema9 = mythical_ema(close, 9, 1.2, 0.5) // Hermes - quick & nimble
ema20 = mythical_ema(close, 20, 1.0, 0.3) // Apollo - short-term foresight
ema50 = mythical_ema(close, 50, 0.9, 0.2) // Athena - wise strategist
ema100 = mythical_ema(close, 100, 0.8, 0.1) // Zeus - powerful oversight
ema200 = mythical_ema(close, 200, 0.7, 0.05) // Kronos - long-term patience
```
- **What it does**: Applies the custom EMA function to the close price with varying lengths (9, 20, 50, 100, 200 periods), base alphas (decreasing from 1.2 to 0.7 for longer periods to make shorter ones more responsive), and volatility factors (decreasing from 0.5 to 0.05 to reduce volatility influence on longer-term EMAs).
- **Purpose**: These form a multi-timeframe EMA ribbon:
- Shorter EMAs (e.g., 9 and 20) capture short-term momentum.
- Longer ones (e.g., 200) show long-term trends.
- Crossovers (e.g., short EMA crossing above long EMA) can signal buy/sell opportunities. The volatility adjustment makes them "mythical" by adding dynamism, potentially improving signal quality in real markets.
### 4. **VWAP Calculation**
```pine
vwap_val = ta.vwap(close) // VWAP based on close price
```
- **What it does**: Computes the Volume Weighted Average Price (VWAP) using the built-in `ta.vwap` function, anchored to the close price. VWAP is the average price weighted by volume over the session (resets daily by default in Pine Script).
- **Purpose**: VWAP acts as a benchmark for "fair value." Prices above VWAP suggest bullishness (buyers in control), below indicate bearishness (sellers dominant). It's commonly used by institutional traders to assess entry/exit points.
### 5. **Plotting EMAs and VWAP**
```pine
plot(ema9, color=color.fuchsia, title='EMA 9 (Hermes)')
plot(ema20, color=color.red, title='EMA 20 (Apollo)')
plot(ema50, color=color.orange, title='EMA 50 (Athena)')
plot(ema100, color=color.aqua, title='EMA 100 (Zeus)')
plot(ema200, color=color.blue, title='EMA 200 (Kronos)')
plot(vwap_val, color=color.yellow, linewidth=2, title='VWAP')
```
- **What it does**: Overlays the EMAs and VWAP on the chart with distinct colors and titles for easy identification in TradingView's legend.
- **Purpose**: Visualizes the EMA ribbon and VWAP line. Traders can watch for EMA alignments (e.g., all sloping up for uptrend) or price interactions with VWAP.
### 6. **Dynamic VWAP Band**
```pine
band_pct = 0.005
vwap_upper = vwap_val * (1 + band_pct)
vwap_lower = vwap_val * (1 - band_pct)
p1 = plot(vwap_upper, color=color.new(color.yellow, 0), title="VWAP Upper Band")
p2 = plot(vwap_lower, color=color.new(color.yellow, 0), title="VWAP Lower Band")
fill_color = close >= vwap_val ? color.new(color.green, 80) : color.new(color.red, 80)
fill(p1, p2, color=fill_color, title="Dynamic VWAP Band")
```
- **What it does**: Creates a band ±0.5% around the VWAP.
- Plots the upper/lower bands with full transparency (color opacity 0, so lines are invisible).
- Fills the area between them dynamically: Semi-transparent green (opacity 80) if close ≥ VWAP (bullish bias), red if below (bearish bias).
- **Purpose**: Highlights deviations from VWAP visually. The color change provides an at-a-glance sentiment indicator—green for "above fair value" (potential strength), red for "below" (potential weakness). The narrow band (0.5%) focuses on short-term fairness, and the fill makes it easier to spot than just the line.
### 7. **Trend Clouds with VWAP Interaction**
```pine
bullish = ema9 > ema20 and ema20 > ema50
bearish = ema9 < ema20 and ema20 < ema50
bullish_above_vwap = bullish and close > vwap_val
bullish_below_vwap = bullish and close <= vwap_val
bearish_below_vwap = bearish and close < vwap_val
bearish_above_vwap = bearish and close >= vwap_val
bgcolor(bullish_above_vwap ? color.new(color.green, 50) : na, title="Bullish Above VWAP")
bgcolor(bullish_below_vwap ? color.new(color.green, 80) : na, title="Bullish Below VWAP")
bgcolor(bearish_below_vwap ? color.new(color.red, 50) : na, title="Bearish Below VWAP")
bgcolor(bearish_above_vwap ? color.new(color.red, 80) : na, title="Bearish Above VWAP")
```
- **What it does**: Defines trend conditions based on EMA alignments:
- Bullish: Shorter EMAs stacked above longer ones (9 > 20 > 50, indicating upward momentum).
- Bearish: The opposite (downward momentum).
- Sub-conditions combine with VWAP: E.g., bullish_above_vwap is true only if bullish and price > VWAP.
- Applies background colors (bgcolor) to the entire chart pane:
- Strong bullish (above VWAP): Green with opacity 50 (less transparent, more intense).
- Weak bullish (below VWAP): Green with opacity 80 (more transparent, less intense).
- Strong bearish (below VWAP): Red with opacity 50.
- Weak bearish (above VWAP): Red with opacity 80.
- If no condition matches, no color (na).
- **Purpose**: Creates "clouds" for trend visualization, enhanced by VWAP context. This helps traders confirm trends—e.g., a strong bullish cloud (darker green) suggests a high-conviction uptrend when price is above VWAP. The varying opacity differentiates signal strength: Darker for aligned conditions (trend + VWAP agreement), lighter for misaligned (potential weakening or reversal).
### Overall Indicator Usage and Limitations
- **How to use it**: Add this to a TradingView chart (e.g., stocks, crypto, forex). Look for EMA crossovers, price bouncing off EMAs/VWAP, or cloud color changes as signals. Bullish clouds with price above VWAP might signal buys; bearish below for sells.
- **Strengths**: Combines momentum (EMAs), volume (VWAP), and volatility adaptation for a multi-layered view. Dynamic colors make it intuitive.
- **Limitations**:
- EMAs lag in ranging markets; volatility adjustment helps but doesn't eliminate whipsaws.
- VWAP resets daily (standard behavior), so it's best for intraday/session trading.
- No alerts or inputs for customization (e.g., changeable lengths)—it's hardcoded.
- Performance depends on the asset/timeframe; backtest before using.
- **License**: Mozilla Public License 2.0, so it's open-source and modifiable.
Infinite EMA with Alpha Control♾️ Infinite EMA with Alpha Control
What Makes This EMA "Infinite"?
Unlike traditional EMA indicators that are limited to typical periods (1-5000), this Infinite EMA breaks all boundaries. You can create EMAs with periods of 1,000, 10,000, or even 1,000,000 bars - that's why it's called "infinite"! Also Infinite EMA starts working immediately from the very first bar on your chart
Why This EMA is "Infinite":
1. Mathematically: When N → ∞, alpha → 0, meaning infinitely long "memory"
2. Practically: You can set any period - even 100,000 bars
3. Flexibility: Alpha allows precise control over the "forgetting speed"
How Does It Work?
The magic lies in the Alpha parameter. While regular EMAs use fixed formulas, this indicator gives you direct control over the EMA's "memory" through Alpha values:
• High Alpha (0.1-0.2): Fast reaction, short memory
• Medium Alpha (0.01-0.05): Balanced response
• Low Alpha (0.0001-0.001): Extremely slow reaction, very long memory
• Ultra-low Alpha (0.000001): Almost frozen in time
The Mathematical Formula:
Alpha = 2 / (Period + 1)
This means you can achieve any EMA period by adjusting Alpha, giving you infinite flexibility!
Expanded "Infinite EMA" Table:
Period EMA (N) - Alpha (Rounded) - Alpha (Exact) - Description
10 - 0.1818 - 0.181818... - Fast EMA
20 - 0.0952 - 0.095238... - Short-term
50 - 0.0392 - 0.039215... - Medium-term
100 - 0.0198 - 0.019801... - Long-term
200 - 0.0100 - 0.009950... - Standard long-term
500 - 0.0040 - 0.003996... - Very long-term
1,000 - 0.0020 - 0.001998... - Super long-term
2,000 - 0.0010 - 0.000999... - Ultra long-term
5,000 - 0.0004 - 0.000399... - Mega long-term
10,000 - 0.0002 - 0.000199... - Giga long-term
25,000 - 0.00008 - 0.000079... - Century-scale EMA
50,000 - 0.00004 - 0.000039... - Practically motionless
100,000 - 0.00002 - 0.000019... - "Glacial" EMA
500,000 - 0.000004 - 0.000003... - Geological timescale
1,000,000 - 0.000002 - 0.000001... - Approaching constant
5,000,000 - 0.0000004 - 0.0000003... - Virtually static
10,000,000 - 0.0000002 - 0.0000001... - Nearly flat line
100,000,000 - 0.00000002 - 0.00000001... - Mathematical infinity
Formula: Alpha = 2/(N+1) where N is the EMA period
Key Features:
Dual EMA System: Run fast and slow EMAs simultaneously
Crossover Signals: Automatic buy/sell signals with customizable alerts
Alpha Control: Direct mathematical control over EMA behavior
Infinite Periods: From 1 to 100,000,000+ bars
Visual Customization: Colors, fills, backgrounds, signal sizes
Instant Start: Works accurately from the very first bar
Update Intervals: Control calculation frequency for noise reduction
Why Choose Infinite EMA?
1. Unlimited Flexibility: Any period you can imagine
2. Mathematical Precision: Direct alpha control for exact behavior
3. Professional Grade: Suitable for all trading styles
4. Easy to Use: Simple settings with powerful results
5. No Warm-up Period: Accurate values from bar #1
Simple Explanation:
Think of EMA as a "memory system":
• High Alpha = Short memory (forgets quickly, reacts fast)
• Low Alpha = Long memory (remembers everything, moves slowly)
With Infinite EMA, you can set the "memory length" to anything from seconds to centuries!
⚡ Instant Start Feature - EMA from First Bar
Immediate Calculation from Bar #1
Unlike traditional EMA indicators that require a "warm-up period" of N bars before showing accurate values, Infinite EMA starts working immediately from the very first bar on your chart.
How It Works:
Traditional EMA Problem:
• Standard 200-period EMA: Needs 200+ bars to become accurate
• First 200 bars: Shows incorrect/unstable values
• Result: Large portions of historical data are unusable
Infinite EMA Solution:
Bar #1: EMA = Current Price (perfect starting point)
Bar #2: EMA = Alpha × Price + (1-Alpha) × Previous EMA
Bar #3: EMA = Alpha × Price + (1-Alpha) × Previous EMA
...and so on
Key Benefits:
No Warm-up Period: Start trading signals from day one
Full Chart Coverage: Every bar has a valid EMA value
Historical Accuracy: Backtesting works on entire dataset
New Markets: Works perfectly on newly listed assets
Short Datasets: Effective even with limited historical data
Practical Impact:
Scenario Traditional EMA Infinite EMA
New cryptocurrency Unusable for first 200 days ✅ Works from day 1
Limited data (< 200 bars) Inaccurate values ✅ Fully functional
Backtesting Must skip first 200 bars ✅ Test entire history
Real-time trading Wait for stabilization ✅ Trade immediately
Technical Implementation:
if barstate.isfirst
EMA := currentPrice // Perfect initialization
else
EMA := alpha × currentPrice + (1-alpha) × previousEMA
This smart initialization ensures mathematical accuracy from the very first calculation, eliminating the traditional EMA "ramp-up" problem.
Why This Matters:
For Backesters: Use 100% of available data
For Live Trading: Get signals immediately on any timeframe
For Researchers: Analyze complete datasets without gaps
Bottom Line: Infinite EMA is ready to work the moment you add it to your chart - no waiting, no warm-up, no exceptions!
Unlike traditional EMAs that require a "warm-up period" of 200+ bars before showing accurate values, Infinite EMA starts working immediately from bar #1.
This breakthrough eliminates the common problem where the first portion of your chart shows unreliable EMA data. Whether you're analyzing a newly listed cryptocurrency, working with limited historical data, or backtesting strategies, every single bar provides mathematically accurate EMA values.
No more waiting periods, no more unusable data sections - just instant, reliable trend analysis from the moment you apply the indicator to any chart.
🔄 Update Interval Bars Feature
The Update Interval feature allows you to control how frequently the EMA recalculates, providing flexible noise filtering without changing the core mathematics.
Set to 1 for standard behavior (updates every bar), or increase to 5-10 for smoother signals that update less frequently. Higher intervals reduce market noise and false signals but introduce slightly more lag. This is particularly useful on volatile timeframes where you want the EMA's directional bias without every minor price fluctuation affecting the calculation.
Perfect for swing traders who prefer cleaner, more stable trend lines over hyper-responsive indicators.
Conclusion
The Infinite EMA transforms the traditional EMA from a fixed-period tool into a precision instrument with unlimited flexibility. By understanding the Alpha-Period relationship, traders can create custom EMAs that perfectly match their trading style, timeframe, and market conditions.
The "infinite" nature comes from the ability to set any period imaginable - from ultra-fast 2-bar EMAs to glacially slow 10-million-bar EMAs, all controlled through a single Alpha parameter.
________________________________________
Whether you're a beginner looking for simple trend following or a professional researcher analyzing century-long patterns, Infinite EMA adapts to your needs. The power of infinite periods is now in your hands! 🚀
Go forward to the horizon. When you reach it, a new one will open up.
- J. P. Morgan

Multi-Timeframe EMAs with Cross Alerts (Up & Down)📌 Indicator Name:
Multi-Timeframe EMAs with Cross Alerts (Up & Down)
🛠️ Core Features:
✅ 1. Multi-Timeframe EMA Display
The script calculates and displays 6 different Exponential Moving Averages (EMAs).
Each EMA has:
Custom length input (e.g., 9, 21, etc.).
Custom timeframe selection (e.g., 1H, 4H, 1D).
Custom color for easy identification on the chart.
✅ 2. EMA Visualization
Each of the six EMAs is plotted on the chart using the selected color and thickness.
They respond dynamically to different timeframes (current or higher/lower).
✅ 3. Cross Detection Logic
The script can detect crossover and crossunder between EMA pairs:
EMA 1 and EMA 2
EMA 3 and EMA 4
EMA 5 and EMA 6
(Optional: can be extended to other combinations.)
✅ 4. Alert Toggles
Users can enable or disable alerts for each pair independently:
Alert: EMA 1 crosses EMA 2
Alert: EMA 3 crosses EMA 4
Alert: EMA 5 crosses EMA 6
(You added an additional option for EMA 4 vs EMA 6 later.)
✅ 5. Visual Alert Markers
The script uses alert() function to send alert messages when:
An EMA crosses above another (crossover)
An EMA crosses below another (crossunder)
Alerts include clear icons like 🔼 and 🔽 in the messages.
🔔 Use Case Scenarios
Swing traders: Identify longer-term cross signals on higher timeframes.
Scalpers: Use lower-timeframe EMAs with fast alert reactions.
Multi-timeframe analysis: Spot alignment between trend-following EMAs across different periods.
✅ Bonus
Fully customizable — great for adapting to your own strategy, whether it's trend confirmation, re-entry signals, or early reversals
📌 اسم المؤشر:
المتوسطات المتحركة الأسية (EMA) متعددة الفريمات مع تنبيهات تقاطع صاعدة وهابطة
🛠️ الميزات الأساسية:
✅ 1. دعم متعدد للفريمات الزمنية
يقوم السكربت بحساب وعرض 6 متوسطات متحركة أسية (EMA) مختلفة.
يمكن تخصيص كل EMA من حيث:
الطول (مثل: 9، 21...).
الفريم الزمني (مثل: الساعة، الأربع ساعات، اليومي...).
اللون، لتسهيل التمييز بين الخطوط على الشارت.
✅ 2. عرض المتوسطات على الرسم البياني
يتم رسم كل من المتوسطات الستة باستخدام اللون والتنسيق الذي تختاره.
المتوسطات تتفاعل تلقائيًا مع التغييرات في الفريم الزمني.
✅ 3. كشف التقاطعات
يمكن للسكربت كشف تقاطعات (صعودًا أو هبوطًا) بين أزواج المتوسطات التالية:
EMA 1 و EMA 2
EMA 3 و EMA 4
EMA 5 و EMA 6
(ويمكنك إضافة المزيد مثل EMA 4 مع EMA 6 حسب الحاجة)
✅ 4. التحكم في التنبيهات
يمكن للمستخدم تفعيل أو تعطيل التنبيهات لكل زوج من المتوسطات على حدة:
تنبيه عند تقاطع EMA 1 و EMA 2
تنبيه عند تقاطع EMA 3 و EMA 4
تنبيه عند تقاطع EMA 5 و EMA 6
(وأي أزواج إضافية يتم إضافتها لاحقًا)
✅ 5. تنبيهات مرئية برسائل واضحة
السكربت يرسل تنبيهات عبر وظيفة alert() عند حدوث:
تقاطع صاعد (EMA يتقاطع من الأسفل إلى الأعلى).
تقاطع هابط (EMA يتقاطع من الأعلى إلى الأسفل).
التنبيه يحتوي على رموز توضيحية مثل 🔼 و 🔽 ليسهل قراءته.
🎯 مناسب لـ:
المتداولين المتأرجحين (Swing Traders): لاكتشاف تقاطعات على الفريمات الكبرى.
المضاربين (Scalpers): باستخدام EMA سريعة على فريمات صغيرة مع تنبيهات فورية.
محللي الفريمات المتعددة: لتأكيد الاتجاه أو الانعكاس بناءً على تقاطع متوسطات من فريمات مختلفة.
✅ مزايا إضافية:
قابل للتخصيص بشكل كامل حسب استراتيجيتك.
مناسب لعدة أساليب: تأكيد الترند، إعادة الدخول، أو إشارات الانعكاس المبكر.

EMA Crossover with RSI and DistanceEMA Crossover with RSI and Distance Strategy
This strategy combines Exponential Moving Averages (EMA) with Relative Strength Index (RSI) and distance-based conditions to generate buy, sell, and neutral signals. It is designed to help traders identify entry and exit points based on multiple technical indicators.
Key Components:
Exponential Moving Averages (EMA):
The strategy uses four EMAs: EMA 5, EMA 13, EMA 40, and EMA 55.
A buy signal (long) is triggered when EMA 5 crosses above EMA 13 and EMA 40 crosses above EMA 55.
A sell signal (short) is generated when EMA 55 crosses above EMA 40.
The distance between EMAs (5 and 13) is also important. If the current distance between EMA 5 and EMA 13 is smaller than the average distance over the last 5 candles, a neutral condition is triggered, preventing a signal even if all other conditions are met.
Relative Strength Index (RSI):
The 14-period RSI is used to determine market strength and direction.
The strategy requires RSI to be above 50 and greater than the average RSI (over the past 14 periods) for a buy signal.
If the RSI is above 60, a green signal is given, indicating a strong bullish condition, even if the EMA conditions are not fully met.
If the RSI is below 40, a red signal is given, indicating a strong bearish condition, regardless of the EMA crossover.
Distance Conditions:
The strategy calculates the distance between EMA 5 and EMA 13 on each candle and compares it to the average distance of the last 5 candles.
If the current distance between EMA 5 and EMA 13 is lower than the average of the last 5 candles, a neutral signal is triggered. This helps avoid entering a trade when the market is losing momentum.
Additionally, if the distance between EMA 40 and EMA 13 is greater than the previous distance, the previous signal is kept intact, ensuring that the trend is still strong enough for the signal to remain valid.
Signal Persistence:
Once a buy (green) or sell (red) signal is triggered, it remains intact as long as the price is closing above EMA 5 for long trades or below EMA 55 for short trades.
If the price moves below EMA 5 for long trades or above EMA 55 for short trades, the signal is recalculated based on the most recent conditions.
Signal Display:
Green Signals: Represent a strong buy signal and are shown below the candle when the RSI is above 60.
Red Signals: Represent a strong sell signal and are shown above the candle when the RSI is below 40.
Neutral Signals: Displayed when the conditions for entry are not met, specifically when the EMA distance condition is violated.
Long and Short Signals: Additional signals are shown based on the EMA crossovers and RSI conditions. These signals are plotted below the candle for long positions and above the candle for short positions.
Trade Logic:
Long Entry: Enter a long trade when EMA 5 crosses above EMA 13, EMA 40 crosses above EMA 55, and the RSI is above 50 and greater than the average RSI. Additionally, the current distance between EMA 5 and EMA 13 should be larger than the average distance of the last 5 candles.
Short Entry: Enter a short trade when EMA 55 crosses above EMA 40 and the RSI is below 40.
Neutral Condition: If the distance between EMA 5 and EMA 13 is smaller than the average distance over the last 5 candles, the strategy will not trigger a signal, even if other conditions are met.

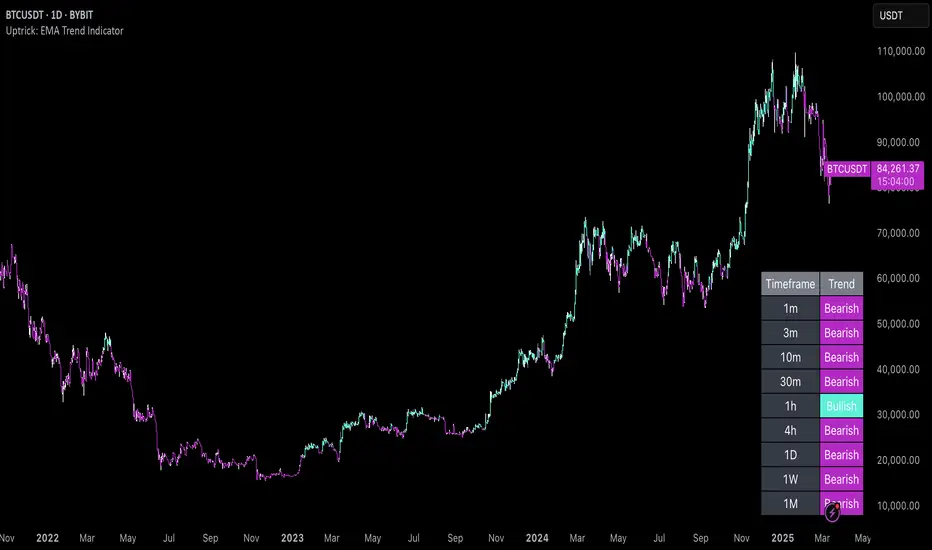
Uptrick: EMA Trend Indicator
### Overview
The goal of this script is to visually indicate on a trading chart whether all three Exponential Moving Averages (EMAs) are trending upwards (i.e., their slopes are positive). If all EMAs are trending upwards, the script will color the bars green. If not, the bars will be colored red.
### Key Concepts
1. **Exponential Moving Average (EMA)**: An EMA is a type of moving average that places more weight on recent data, making it more responsive to price changes compared to a simple moving average (SMA). In this script, we use three different EMAs with different lengths (20, 50, and 200 periods).
2. **Slope of an EMA**: The slope of an EMA refers to the direction in which the EMA is moving. If the current value of the EMA is higher than its value in the previous bar, the slope is positive (upward). Conversely, if the current value is lower than its previous value, the slope is negative (downward).
3. **Bar Color Coding**: The script changes the color of the bars on the chart to provide a visual cue:
- **Green Bars**: Indicate that all three EMAs are trending upwards.
- **Red Bars**: Indicate that one or more EMAs are not trending upwards.
### Detailed Breakdown
#### 1. Input Fields
- **EMA Lengths**: The script starts by allowing the user to input the lengths for the three EMAs. These lengths determine how many periods (e.g., days) are used to calculate each EMA.
- `ema20_length` is set to 20, meaning the first EMA uses the last 20 bars of data.
- `ema50_length` is set to 50, meaning the second EMA uses the last 50 bars of data.
- `ema200_length` is set to 200, meaning the third EMA uses the last 200 bars of data.
#### 2. EMA Calculation
- The script calculates the values of the three EMAs:
- **EMA 20**: This is calculated using the last 20 bars of closing prices.
- **EMA 50**: This is calculated using the last 50 bars of closing prices.
- **EMA 200**: This is calculated using the last 200 bars of closing prices.
These calculations result in three values for each bar on the chart, each representing the EMA value at that point in time.
#### 3. Determining EMA Slopes
- **EMA Slopes**: To understand the trend of each EMA, the script compares the current value of each EMA to its value in the previous bar:
- For the 20-period EMA, the script checks if today’s EMA value is higher than yesterday’s EMA value.
- This process is repeated for the 50-period and 200-period EMAs.
- If today’s EMA value is greater than yesterday’s value, the slope is positive (upward).
- If today’s EMA value is not greater (it is either equal to or less than yesterday’s value), the slope is not positive.
#### 4. Evaluating All Slopes
- **All Slopes Positive Condition**: The script combines the results of the individual slope checks into a single condition. It uses a logical "AND" operation:
- The condition will be `true` only if all three EMAs (20, 50, and 200) have positive slopes.
- If any one of the EMAs does not have a positive slope, the condition will be `false`.
#### 5. Coloring the Bars
- **Bar Coloring Logic**: Based on the above condition, the script decides the color of each bar on the chart:
- If all slopes are positive (condition is `true`), the bar is colored green.
- If any slope is not positive (condition is `false`), the bar is colored red.
- **Visual Cue**: This provides a quick, visual indication to traders:
- Green bars suggest that the market is in an upward trend across all three EMAs, which might indicate a strong bullish trend.
- Red bars suggest that the trend is not uniformly upward, which could be a sign of weakening momentum or a potential reversal.
#### 6. Alerts
- **Alert Conditions**: The script also allows for alert conditions to be set based on the slope analysis:
- An alert can be triggered when all EMA slopes are positive. This might be useful for traders who want to be notified when the market shows strong upward momentum.
### Summary
- The script essentially takes the market data and applies three different EMAs to it, each with a different time frame.
- It then checks the direction (slope) of each of these EMAs to determine if they are all trending upwards.
- If they are, the script colors the bar green, signaling a potentially strong bullish trend.
- If any of the EMAs is not trending upwards, it colors the bar red, indicating a potential issue with the strength of the trend.
This approach helps traders quickly assess market conditions based on multiple EMAs, providing a clearer picture of the overall trend across different time frames.
Multiple EMA Indicator [Pineify]TradingView Multiple EMA Indicator: A Comprehensive Trend Analysis Tool
The TradingView Multiple EMA Indicator is a powerful and versatile tool designed to provide traders with a comprehensive view of market trends across multiple timeframes. By incorporating five Exponential Moving Averages (EMAs) with customizable lengths and sources, this indicator offers a nuanced approach to trend analysis, suitable for both novice and experienced traders.
Key Features:
Five customizable EMAs for multi-timeframe analysis
Flexible source inputs for each EMA
Color-coded plots for easy visual interpretation
Overlay functionality for direct price action comparison
How It Works:
This indicator calculates and displays five separate EMAs on your chart, each with its own customizable length and source. The EMAs are color-coded for easy identification:
EMA-1: Red
EMA-2: Light Green
EMA-3: Light Blue
EMA-4: Purple
EMA-5: Yellow
By default, the indicator uses the following settings:
EMA-1: 10-period EMA of close price
EMA-2: 20-period EMA of close price
EMA-3: 50-period EMA of close price
EMA-4: 100-period EMA of close price
EMA-5: 200-period EMA of close price
However, users can easily adjust these settings to suit their specific trading strategies and preferences.
Trading Ideas and Insights:
The Multiple EMA Indicator offers several ways to analyze market trends and generate trading signals:
Trend Identification: The alignment of the EMAs can help identify the overall trend. When shorter-term EMAs are above longer-term EMAs, it suggests an uptrend, and vice versa for a downtrend.
Dynamic Support and Resistance: Each EMA can act as a dynamic support or resistance level. Price bouncing off these levels can indicate potential entry or exit points.
Crossovers: When a shorter-term EMA crosses above a longer-term EMA, it may signal a bullish trend change. Conversely, a bearish signal may occur when a shorter-term EMA crosses below a longer-term EMA.
Trend Strength: The spacing between the EMAs can indicate trend strength. Wide spacing suggests a strong trend, while narrow spacing or intertwining EMAs may indicate consolidation or a weakening trend.
Multi-Timeframe Analysis: By using different EMA lengths, traders can gain insights into short-term, medium-term, and long-term trends simultaneously.
How to Use the Indicator:
Add the indicator to your chart and adjust the input parameters as needed.
Observe the relative positions of the EMAs to identify the overall trend direction.
Look for potential entry signals when price or shorter-term EMAs cross above or below longer-term EMAs.
Use the EMAs as dynamic support and resistance levels for setting stop-loss and take-profit orders.
Combine the Multiple EMA Indicator with other technical analysis tools, such as oscillators or volume indicators, for more comprehensive trading decisions.
Customization Options:
The indicator offers extensive customization options, allowing traders to tailor it to their specific needs:
Adjust the length of each EMA to focus on different timeframes
Change the source of each EMA (e.g., close, open, high, low, HL2, HLC3, OHLC4)
Modify the color and line thickness of each EMA for better visibility
Conclusion:
The TradingView Multiple EMA Indicator is a versatile and powerful tool for trend analysis and trade decision-making. By providing a multi-faceted view of market trends, it enables traders to make more informed decisions based on a comprehensive understanding of price action across various timeframes.
Remember that while this indicator can be a valuable tool in your trading arsenal, it should not be used in isolation. Always combine it with other forms of analysis and proper risk management techniques for the best results.
We hope this indicator enhances your trading experience and contributes to your success in the markets. Happy trading!

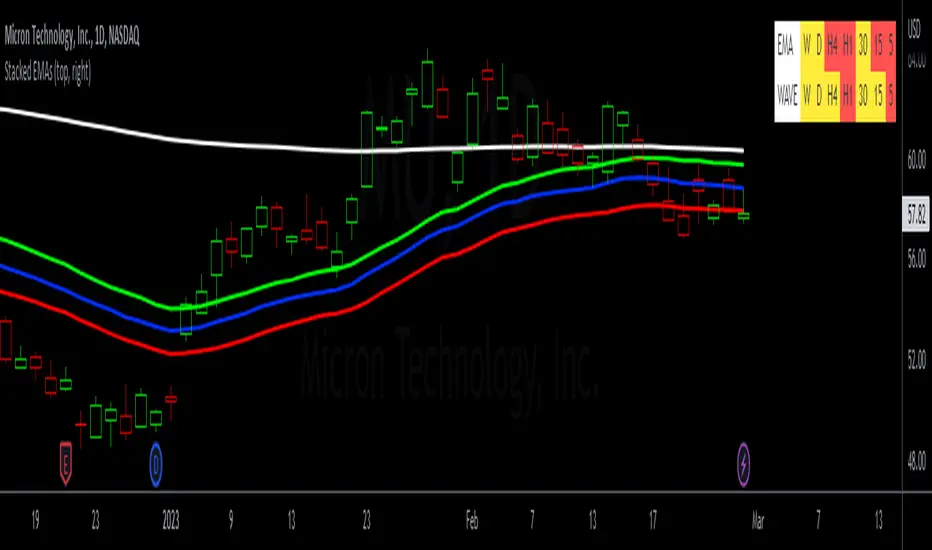
Sembang Kari Traders - EMA & Wave Stacked Labels + EMA 34 LinesThis script is 2 in 1 indicator.
1. Multi Timeframe EMA Labels
- This label indicator shows labels for EMA stacked up or EMA stacked down or EMA in sideway trend.
- EMA used in this script is EMA 8, EMA 21, EMA 34 and EMA 55.
- If the EMA 8 line is above EMA 21 line, and EMA 21 line is above EMA 34 line, and EMA 34 line is above EMA 55 line ( EMA STACKED UP) = the trend is BULLISH and the label will colored to GREEN on that timeframe.
- If the EMA 8 line is below EMA 21 line, and EMA 21 line is below EMA 34 line, and EMA 34 line is below EMA 55 line ( EMA STACKED DOWN) = the trend is BEARISH and the label will colored to RED on that timeframe.
- If either 1 of the EMA 8, or EMA 21, or EMA 34, or EMA 55 is NOT STACKED = the trend is SIDEWAY and the label will colored to YELLOW on that timeframe.
- Timeframe shows in label is Daily, 4 hours, 1 hour, 15 minutes and 5 minutes.
- This indicator labels will be useful to identifying trend in others timeframe without to look or open that other timeframe. Example, if u in 5 minutes timeframe chart, then u see that "D" is colored to GREEN, then straight will know that EMA 8, EMA 21, EMA 34 and EMA 55 is STACKED UP which means BULLISH without to look or open that Daily timeframe .
2. EMA 34 Lines
- This is indicator shows 3 exponential moving average line which is EMA 34 lines.
- This indicator will shows 3 lines which is GREEN, BLUE, and RED.
- The GREEN line is EMA 34 HIGH
- The BLUE line is EMA 34 CLOSE
- The RED line is EMA 34 BLUE
Trade Idea
- The idea using this indicator is we want to take an entry setup when the candle pull back to EMA 34 lines and at the same time using the EMA labels to be confirmation as label will indicates trends in multiple timeframe.
- When price moved far away from EMA 34 lines, then wait till price pullback to EMA lines and confirmed it by trend labels provided to take take a entry setup.
- this indicator can be used on all tickers
HawkEye EMA Cloud
# HawkEye EMA Cloud - Enhanced Multi-Timeframe EMA Analysis
## Overview
The HawkEye EMA Cloud is an advanced technical analysis indicator that visualizes multiple Exponential Moving Average (EMA) relationships through dynamic color-coded cloud formations. This enhanced version builds upon the original Ripster EMA Clouds concept with full customization capabilities.
## Credits
**Original Author:** Ripster47 (Ripster EMA Clouds)
**Enhanced Version:** HawkEye EMA Cloud with advanced customization features
## Key Features
### 🎨 **Full Color Customization**
- Individual bullish and bearish colors for each of the 5 EMA clouds
- Customizable rising and falling colors for EMA lines
- Adjustable opacity levels (0-100%) for each cloud independently
### 📊 **Multi-Layer EMA Analysis**
- **5 Configurable EMA Cloud Pairs:**
- Cloud 1: 8/9 EMAs (default)
- Cloud 2: 5/12 EMAs (default)
- Cloud 3: 34/50 EMAs (default)
- Cloud 4: 72/89 EMAs (default)
- Cloud 5: 180/200 EMAs (default)
### ⚙️ **Advanced Customization Options**
- Toggle individual clouds on/off
- Adjustable EMA periods for all timeframes
- Optional EMA line display with color coding
- Leading period offset for cloud projection
- Choice between EMA and SMA calculations
- Configurable source data (HL2, Close, Open, etc.)
## How It Works
### Cloud Formation
Each cloud is formed by the area between two EMAs of different periods. The cloud color dynamically changes based on:
- **Bullish (Green/Custom):** When the shorter EMA is above the longer EMA
- **Bearish (Red/Custom):** When the shorter EMA is below the longer EMA
### Multiple Timeframe Analysis
The indicator provides a comprehensive view of trend strength across multiple timeframes:
- **Short-term:** Clouds 1-2 (faster EMAs)
- **Medium-term:** Cloud 3 (intermediate EMAs)
- **Long-term:** Clouds 4-5 (slower EMAs)
## Trading Applications
### Trend Identification
- **Strong Uptrend:** Multiple clouds stacked bullishly with price above
- **Strong Downtrend:** Multiple clouds stacked bearishly with price below
- **Consolidation:** Mixed cloud colors indicating sideways movement
### Entry Signals
- **Bullish Entry:** Price breaking above bearish clouds turning bullish
- **Bearish Entry:** Price breaking below bullish clouds turning bearish
- **Confluence:** Multiple cloud confirmations strengthen signal reliability
### Support/Resistance Levels
- Cloud boundaries often act as dynamic support and resistance
- Thicker clouds (higher opacity) may provide stronger S/R levels
- Multiple cloud intersections create significant price levels
## Customization Guide
### Color Schemes
Create your own visual style by customizing:
1. **Bullish/Bearish colors** for each cloud pair
2. **Rising/Falling colors** for EMA lines
3. **Opacity levels** to layer clouds effectively
### Recommended Settings
- **Day Trading:** Focus on Clouds 1-2 with higher opacity
- **Swing Trading:** Use Clouds 1-3 with moderate opacity
- **Position Trading:** Emphasize Clouds 3-5 with lower opacity
## Technical Specifications
- **Version:** Pine Script v6
- **Type:** Overlay indicator
- **Calculations:** Real-time EMA computations
- **Performance:** Optimized for all timeframes
- **Alerts:** Configurable long/short alerts available
## Risk Disclaimer
This indicator is for educational and informational purposes only. Always combine with proper risk management and additional analysis before making trading decisions. Past performance does not guarantee future results.
---
*Enhanced and customized version of the original Ripster EMA Clouds by Ripster47. This modification adds comprehensive color customization and enhanced user control while preserving the core analytical framework.*

Auto-Length Anchored Multiple EMA (Hour-Based)# Auto-Length Anchored Multiple EMA (Hour-Based)
## Overview
This advanced EMA indicator automatically calculates Exponential Moving Average lengths based on the time elapsed since user-defined anchor dates. Unlike traditional fixed-length EMAs, this indicator dynamically adjusts EMA periods based on actual trading hours, making it ideal for event-based analysis and time-sensitive trading strategies.
## Key Features
### 🎯 **Dual Mode Operation**
- **Auto Mode**: EMA length automatically calculated from anchor date to current time
- **Manual Mode**: Traditional fixed-length EMA calculation
- Switch between modes independently for each EMA
### 📊 **Multiple EMA Support**
- Up to 4 independent EMAs with individual configurations
- Each EMA can have its own anchor date and settings
- Individual enable/disable controls for each EMA
### ⏰ **Smart Time Calculation**
- Accounts for actual trading hours (customizable)
- Weekend exclusion with Saturday trading option (for markets like NSE/BSE)
- Hour multiplier for fine-tuning EMA sensitivity
- Minimum EMA length protection to prevent calculation errors
### 🎨 **Visual Enhancements**
- **Dynamic Fill Colors**: Fill between EMA1 and EMA3 changes color based on price position
- **Customizable Colors**: Individual color settings for each EMA
- **Anchor Visualization**: Optional vertical lines and labels at anchor dates
- **Real-time Table**: Shows current EMA lengths, modes, and values
## Configuration Options
### Trading Session Settings
- **Trading Hours Per Day**: Set your market's trading hours (1-24)
- **Trading Days Per Week**: Configure for different markets (5 for Mon-Fri, 6 for Mon-Sat)
- **Include Saturday**: Enable for markets that trade on Saturday
- **Hour Multiplier**: Fine-tune EMA sensitivity (0.1x to 10x)
### EMA Configuration
- **Anchor Dates**: Set specific start dates for each EMA calculation
- **Manual Lengths**: Override with traditional fixed periods when needed
- **Enable/Disable**: Individual control for each EMA
- **Color Customization**: Personalize appearance for each EMA
### Visual Options
- **Fill Settings**: Toggle and customize fill colors between EMAs
- **Anchor Lines**: Show vertical lines at anchor dates
- **Anchor Labels**: Display formatted anchor date information
- **Length Table**: Real-time display of current EMA parameters
## Use Cases
### 📈 **Event-Based Analysis**
- Anchor EMAs to earnings announcements, policy decisions, or market events
- Track price behavior relative to specific time periods
- Analyze momentum changes from key market catalysts
### 🕐 **Time-Sensitive Trading**
- Perfect for intraday strategies where timing is crucial
- Automatically adjusts to market hours and trading sessions
- Eliminates manual EMA length recalculation
### 🌍 **Multi-Market Support**
- Configurable for different global markets
- Saturday trading support for Asian markets
- Flexible trading hour settings
## Technical Details
### Calculation Method
The indicator calculates trading bars elapsed since anchor date using:
```
Total Trading Bars = (Days Since Anchor × Trading Days Per Week ÷ 7) × Trading Hours Per Day × Hour Multiplier
```
### EMA Formula
Uses standard EMA calculation with dynamically calculated alpha:
```
Alpha = 2 ÷ (Current Length + 1)
EMA = Alpha × Current Price + (1 - Alpha) × Previous EMA
```
### Weekend Handling
- Automatically excludes weekends from calculation
- Optional Saturday inclusion for specific markets
- Accurate trading day counting
## Installation & Setup
1. **Add to Chart**: Apply the indicator to your desired timeframe
2. **Set Anchor Dates**: Configure anchor dates for each EMA you want to use
3. **Adjust Trading Hours**: Set your market's trading session parameters
4. **Customize Appearance**: Choose colors and visual options
5. **Enable Features**: Turn on fills, anchor lines, and information table as needed
## Best Practices
- **Anchor Selection**: Choose significant market events or technical breakouts as anchor points
- **Multiple Timeframes**: Use different anchor dates for short, medium, and long-term analysis
- **Hour Multiplier**: Start with 1.0 and adjust based on market volatility and your trading style
- **Visual Clarity**: Use contrasting colors for different EMAs to improve readability
## Compatibility
- **Pine Script Version**: v6
- **Chart Types**: All chart types supported
- **Timeframes**: Works on all timeframes (optimal on intraday charts)
- **Markets**: Suitable for stocks, forex, crypto, and commodities
## Notes
- Indicator starts calculation from the anchor date forward
- Minimum EMA length prevents calculation errors with very recent anchor dates
- Table display updates in real-time showing current EMA parameters
- Fill colors dynamically change based on price position relative to EMA1
---
*This indicator is perfect for traders who want to combine the power of EMAs with event-driven analysis and precise time-based calculations.*
